
Metadata
- Author: Colin Bryar
- Full Title:: Working Backwards
- Category:: 🗞️Articles
- Document Tags:: Xmr Charts,
- URL:: https://readwise.io/reader/document_raw_content/37098433
- Finished date:: 2024-04-20
Highlights
How disappointing this has been. It does not offer ANY insight.
Why metrics become more important as a company grows. The metrics life cycle. The difference between input metrics and output metrics. Making sure your metrics are unbiased. Using metrics at business reviews. The key pitfalls of the review meeting. (View Highlight)
Small teams, business category lines, and the entire online retail business all have their own WBRs (View Highlight)
Donald Wheeler, in his book Understanding Variation (View Highlight)
Note: Most of the examples we give in this chapter are of large companies with substantial resources. But DMAIC and the Wbr process is eminently scalable. Your level of investment should be on par with the resources you have (View Highlight)
One often-overlooked piece of the puzzle is determining how to audit metrics. Unless you have a regular process to independently validate the metric, assume that over time something will cause it to drift and skew the numbers. If the metric is important, find out a way to do a separate measurement or gather customer anecdotes and see if the information trues up with the metric you’re looking at. (View Highlight)
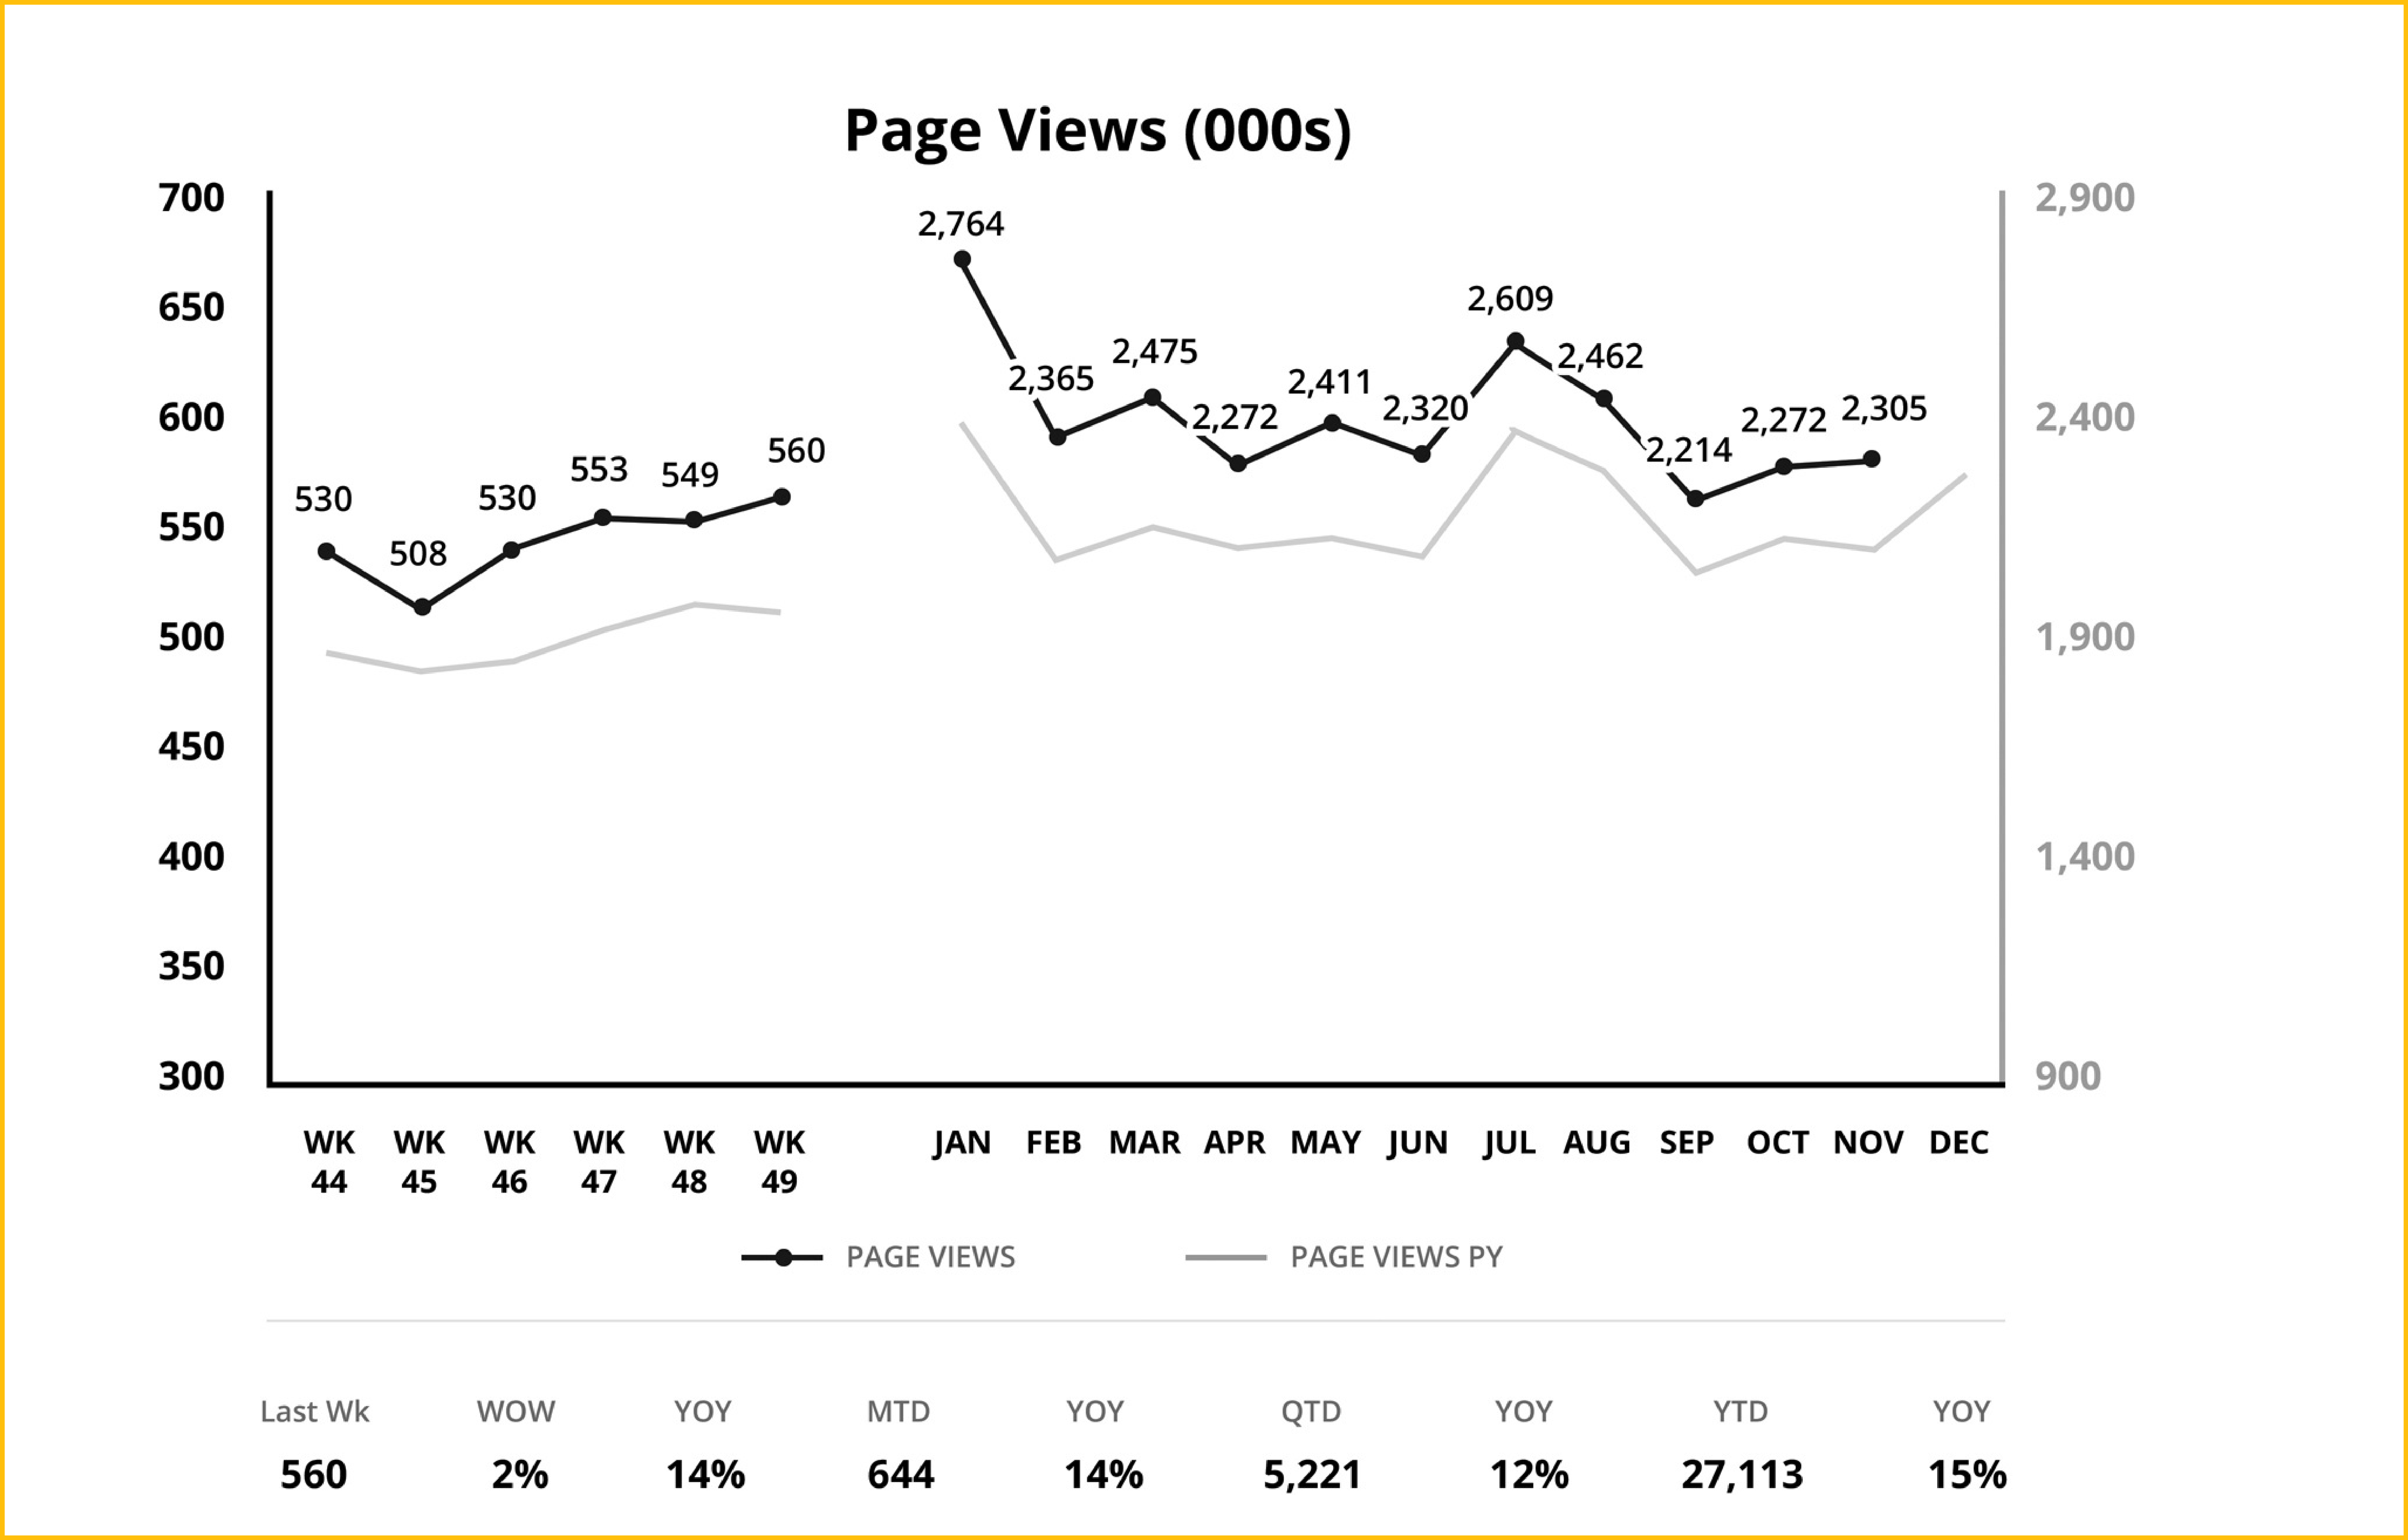
Graphs show two or more timelines, for example, trailing 6-week and trailing 12-month. Trend lines for the short term can magnify small but important issues that are hard to spot when averaged out over longer (View Highlight)
periods. (View Highlight)
The deck is usually owned by someone in finance. Or more accurately, the data in the deck are certified as accurate by finance (View Highlight)
Amazon thereby looks at the same set of data every week, in the same order, and gets a holistic view of the business (View Highlight)
Amazon business owners are responsible for tracking the success of their area as defined by their metrics. In the weekly review, the owners, not the finance team, are expected to provide a crisp explanation for variances against expectations (View Highlight)
at Amazon we routinely place our trailing 6 weeks and trailing 12 months side by side on the same x-axis (View Highlight)
 (
(Without the dotted line, you might not have noticed the rate at which the current and projected year trends are slowly converging. Adding YOY growth rates in addition to the underlying metric you are measuring is a great way to spot trends (View Highlight)