Why are we doing this workshop
Our metrics are now hard to change, explain and to trust:
- They are hard to understand:
- We have very long queries.
- Some are overly complex in logic.
- They are not expressive enough.
- They have no tests.
Although there are also external reasons for this (time pressures, pushing business logic into analytics instead of dealing with it on backends), we can focus on what we control and write more maintainable metrics. Specifically, we will review:
- Data modelling: common ways to structure tables so that metrics are easier to compute.
- SQL best practices.
- dbt as a tool for metric development and shared medium with data engineering.
Apart from this, there are several things we should already be doing, particularly regarding metrics work:
- Peer reviews: a good check that we all understand what one person did.
- Pairing with DE on this matters, instead of just giving them the queries.
Data modeling: why do we need it
![[fight-the-entropyolap-vs-oltp-and-normalization|Fight The Entropy#olap Vs Oltp And Normalization]]
Transform data to make analysis easier, how?
Ad-hoc doesn’t work
“In the past”, there was no modeling, and Data Analysts controlled all reporting in an ad-hoc way.
If you were on a “traditional data team” pre 2012, your first data hire was probably a data engineer. (…) Analysts, like me, would maintain a mess of SQL files with names like
🔗 to original contextmonthly_revenue_final.sql, or maybe just bookmark their queries in a SQL web editor. Often we would need to supplement data in the warehouse with fancy Excel work. The people consuming the data–CEOs, Marketing VPs, CFOs–would receive monthly reports, request special analysis as-needed, and send analysts a never-ending stream of requests to “segment by this” or “cut by that” or “hey, we’ve updated our definition of ‘account’”. Being a data analyst was a hard and thankless job, and it didn’t have a ton of leverage.
Imagine doing this ad-hoc for each business question…
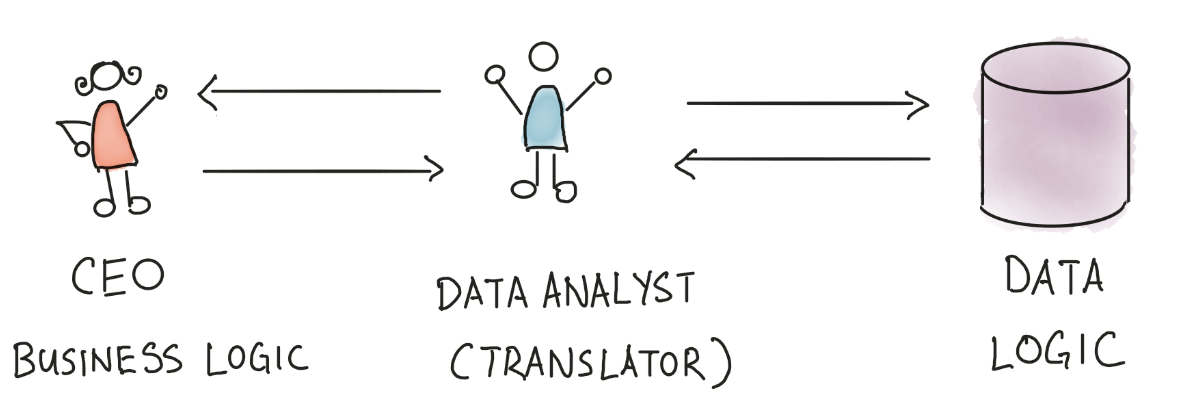
For example: when asking about sales commissions, the CEO will think “sales commissions is 5% of closed deals”. However, the data analyst will think “closed deals are stored in table
closed_deals, so I need to take theamountcolumn and multiply that withmonthsto figure out the final amount; oh, and I need to check thepayment_receivedcolumn to make sure that only the received payment is counted”.
(Data Modeling Layer & Concepts | The Analytics Setup Guidebook)
But this has two main problems. One is being a bottleneck:
Every time the CEO wants something, she needs to wait hours (or even days) for Daniel [the DA] to crunch the numbers and get back to her. At one point, Daniel might be too busy crunching out numbers for different business stakeholders, instead of focusing his time on more valuable, long-term impact work. (Data Modeling Layer & Concepts | The Analytics Setup Guidebook)
The other is entropy: ![[fight-the-entropybuild-awareness-about-a-cultural-problem-data-anarchy|Fight The Entropy#build Awareness About A (cultural) Problem Data Anarchy]]
We will later see that a very important thing to support changing requirements in to expose atomic data.
The star schema / Dimensional modeling
Isn’t there a way to structure information so that answering most business questions is easy, without the need to predict in advance which type of questions are going to be asked? Yes, created by this guy, Ralph Kimball in The Data Warehouse Toolkit 3rd Edition.

It is called both dimensional modeling and star schema, given the final result.
(from What is a star schema and how does it work?)
🔗 to original context
Where does this go in our layered data warehouse?
We will later see more about these “layers”, but this belongs into the “marts” layer of the warehouse. Those marts are just a subset of tables/views (models) by domain, which are the only ones intented to be queried by the end users. That is, all the other layers are just internal intermediate transformations that we shouldn´t query. However, both facts and dimensions could be shared by different marts (we will see “conformed dimensions”).
Core concepts
![[the-data-warehouse-toolkit-3rd-editionkimball-dimensional-modeling|The Data Warehouse Toolkit 3rd Edition#kimball Dimensional Modeling]]
Who is responsible of data modeling?
From Analysts Make The Best Analytics Engineers:
🔗 to original contextYou’ve got three steps that stand between you and your finished curated dataset. If you don’t have an analytics engineer, then the work may be split up like this: (View Highlight)
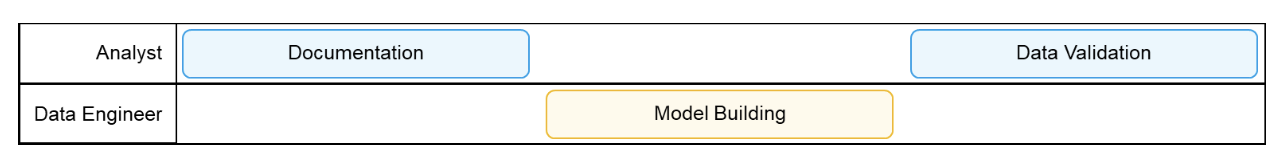
The problem is that this is far from a linear process. It looks more like this:
🔗 to original context
 (
(Which is even worse if we leave validation in the hands of yet another person.
As a curiosity, the Modern Data Stack made somewhat easier to collapse these two functions into a single role:
🔗 to original contextToday, if you’re a “modern data team” your first data hire will be someone who ends up owning the entire data stack. This person can set up Stitch or Fivetran to start ingesting data, keep a data warehouse tidy, write complex data transformations in SQL using dbt, and build reports on top of a clean data layer in Looker, Mode, Redash, etc.
🔗 to original contextThis job is neither data engineering, nor analysis. It’s somewhere in the middle, and it needed a new title. Starting in 2018, we and a few of our friends in the Locally Optimistic community started calling this role the analytics engineer.
But adding such role to the existing Data Engineering and Data Analysis roles (as well as other roles) has been criticized as What Is The Right Level Of Specialization For Data Teams And Anyone Else. Since the skills required are closer to engineering, data modeling traditionally has been in Data Engineering hands, but Data Analysis can pick up certain skills so that this collaboration is tighter and feedback loops are shorter.
Some techniques from dimensional modelling worth knowing
Types of fact tables
Keeping the past from changing: slowly changing dimensiones
- Types of fact tables.
- Handling slowly changing dimensions.
- Surrogate Keys.
- OBTs/Wide tables
- Nulls in Fact Tables
- …
Metrics and Looker
dbt
The vision
It’s for analysts too! From The dbt Viewpoint | dbt Developer Hub:
We believe that analytics teams have a workflow problem. Too often, analysts operate in isolation, and this creates suboptimal outcomes. Knowledge is siloed. We too often rewrite analyses that a colleague had already written.
It’s not a tool to do analysis (meaning queries), but to transform data (e.g., compute metrics).
Writing a model
…
Jinja and macros
…
Packages
Regular tests
…
Unit testing
…
Docs and tribal knowledge
Best practices SQL
…
An IDE for data analytics: Looker SQL Runner / Google Colab
…
Very good refs:
Improvements to our own
- No queda claro el grano de las tablas
- No tenemos FK que nos ayudan a entender cómo relacionarlas.