- Tags:: 🗃Archive, Data Team Vision And Mission, Data Culture
- Date:: 2022-03-08
Example of a data strategy document from PMs of a data-driven company that still has not reached a high level of data maturity.
Entropy: … 2. lack of order or predictability; gradual decline into disorder. “a marketplace where entropy reigns supreme”
(Oxford Languages dictionaries)
🔗 to original contextData, it turns out, doesn’t so much drift towards entropy, but sprints at it.
What is the objective of this article?
Build awareness about a (cultural) problem: data anarchy
People will show up in a meeting to talk through a business problem, and different people will bring mismatched numbers. All too often, data slows decisions down rather than speeds them up, because people spend more time debating if the data is right than they do talking about what to do about it. And all too often, data teams will update core datasets or KPIs, and old versions will linger on for months.
Incidents like these erode trust in data and data teams. It teaches people not to participate in the data democracy, and to make decisions entirely on their own, often without using data at all. (Good Data Citizenship Doesn’t Work | by Benn Stancil | Jan, 2022 | Towards Data Science)
We kinda know why this happens:
….continually creating new combinations of models in all directions as new analytic opportunities arise.
It’s not difficult to imagine why this happens — people have different opinions, habits, and diligence about naming and when developing, it is often easier to build a new thing fit for the new purpose then to integrate your changes into the pre-existing ecosystem, test that yours works without breaking everyone else’s, etc. (On the Importance of Naming: Model Naming Conventions (Part 1) | dbt Developer Blog)
And it happens to us (here there was an internal example of pipeline jungles and inconsistent metrics).
Propose a mindset and a set of actions you can take to go back to data democracy
Data Observability and lineage has certainly helped teams identify and fix problems, and even surface information about what broke and who was impacted,” said Maxime. “Still, change management is just as cultural as it is technical. If decentralized teams are not following processes and workflows that keep downstream consumers or even the central data platform team in the loop, then it’s challenging to handle change effectively.”
Maxime Beauchemin (Facebook DE, Airbnb, founder of Preset) on The Future Of The Data Engineer.
We (Data) are working on tools to help with this, but we believe this is more a cultural problem than a technical one. There is a way to work to avoid this, and this is what we want to introduce here.
Introduce a new tool and technique the Data team will use to manage data
We don’t manipulate our services codebase live on production. Instead, we follow procedures such as version control, peer reviews, testing… Why does this have to be different for data? So, we introduce here a tool you can use to put your data in production.
Additionally, we introduce Dimensional Modeling, a technique our team will use to have your data in a better shape to be queried (and although it may be too technical* to do on your own, it may inspire you on your transformations).
* Although more than that, it requires a very good domain understanding so… you are not really ill-equipped for it.
Why don’t you just “solve it”? Isn’t this like… your job?
We will definitely be providing direct support, but you are the owners of your data, and your data is also your product. You are in a much better position to do better work with it, you know your data better.
Also, if we needed to take care of the data of all teams…
https://www.youtube.com/watch?v=o8NU5Rf3dVI&ab_channel=AlbertoPerez
… we would become a huge bottleneck, apart from going against many principles we are gladly embracing in the organization, such as the Bounded Contexts of Domain Driven Design. We reflect this on the values of our team.
Why working with data is hard right now? Because it is not modeled to match business questions
OLAP vs OLTP and normalization
In the vast majority of applications, the main data access pattern is looking up a small number of records by some key, and records are inserted, updated or deleted based on user’s input. This pattern is known as online transaction processing (OLTP). The term transaction comes from commercial transactions.
To optimize for this access pattern, data is highly normalized.
Imagine storing sales without normalization, like this:
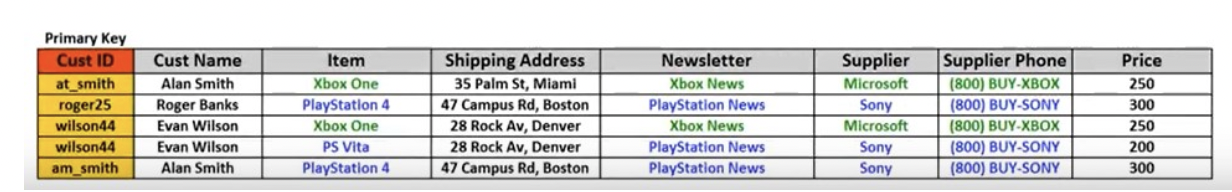
(from Database – Normalisation – 1NF, 2NF, 3NF and 4NF – Journey to Data Science)
What would you need to do to update a supplier phone? However, if you store sales like this:
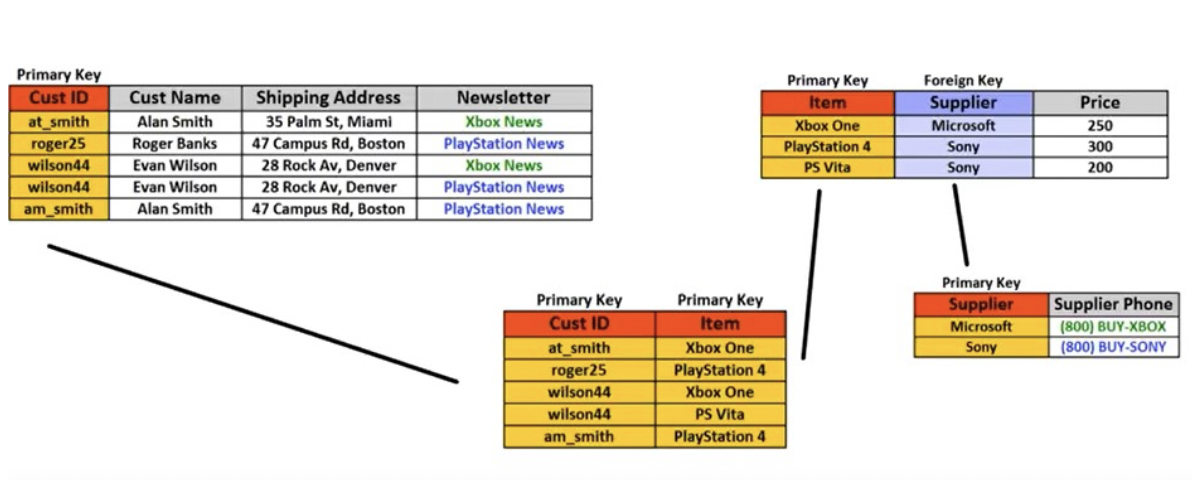
…change only occurs in one place.
This makes sure data integrity is preserved and there is less data to move around.
Unfortunately, normalization is not very friendly to business queries.
[Here we would have a data model and an example query, showing how difficult is to answer a simple question].
Your life can be better than this.
For business queries, the data access pattern is going to be very different than OLTP: for example we will want aggregates over large number or records. This different access pattern is known as OLAP: online analytic processing.
We cross the chasm between OLTP and OLAP by transforming the data (data modeling) so that we make business analysis easier:
 (Data Modeling Layer & Concepts | The Analytics Setup Guidebook)
In the past, this was also required for performance purposes but this does no longer apply in modern data warehouses. However it still applies for logical purposes.
Data modeling in practice
You will surely want to transform and aggregate your data from the relational model we saw first. Let’s review your options: in queries, scheduled queries and views.
Old option 1: Transform the data directly in the queries
Usually, you do this by using Common Table Expressions (CTEs, WITH df_orders AS (SELECT ...))
- Queries end up being very long and thus, hard to understand and error prone.
- If it’s a common operation, you will have the same logic across many of your queries. Such non-shared but common logic becomes hard to change and thus, it becomes easy to have many different versions scattered around.
In order to abstract common logic, then we have the following.
Old option 2: Scheduled queries
These are queries that are run every so often, writing the result to a table.
- They are awful in terms of error notifications.
- They introduce complexity: scheduled executions, which you may need to take into account in your consumers.
- They only make sense if the query they are performing is costly or slow, the output of the query reduces the amount of information to read, and you need to query that information several times.
Old option 3: Views
A view is just a stored query that will be run when you query it. You can query it as if it were a regular table, but unlike the table produced by scheduled query, the results of the stored query that defines the view are not stored, they are computed on-the-fly.
Views should be your default solution when you want to have reusable standard transformations for your team. However, as you start reusing them, you may end up with a bola de pelo of views.
A technical help: introducing dbt
PMs, do we expect you to know this section by heart? No, it is just a showcase of what the tool gives us. Do we expect you to make Pull Requests to the dbt repo? That would be great, but what we propose is for you to partner up with your team engineers once you want to persist some transformations (see the next section).
dbt allow us to express transformations:
- Under version control, with SQL.
- Reuse common fragments.
- Have a clear view of dependencies between views/tables (avoiding bolas de pelo).
- With tests.
- With docs.
Getting started
- Transformations are expressed in SQL.
- You can refer to other transformations or sources and see the dependency graph.
- There are three types of materializations:
- View: should be your default.
- Ephemeral: these are not querieable but can be reusable across projects. This usually are CTEs that are shared across different transformations.
- Table: just like the scheduled queries. A real table will exist as a result of this transformation.
Test definitions
Like almost everything in dbt, tests are SQL queries. In particular, they are
selectstatements that seek to grab “failing” records, ones that disprove your assertion.
-- Refunds have a negative amount, so the total amount should always be >= 0.
-- Therefore return records where this isn't true to make the test fail
select
    order_id,
    sum(amount) as total_amount
from {{ ref('fct_payments' )}}
group by 1
having not(total_amount >= 0)
- There are mechanisms to build generic tests.
- You may even write unit tests although this is a less mature area of dbt (and we haven’t integrated it yet).
Documentation
It is as simple as adding text in a YAML in the code repo, and that generates wonderful docs which we will even be able to sync to Metabase in the future.
The same principles of software documentation applies: the best documentation is that you don’t need. Clear tables and columns names go a long way. In the absence (or insufficiency) of that, descriptions of important or confusing tables and columns will help everybody.
How is this applied to the data warehouse?
A cron per team is run, that:
- Runs sources tests.
- Applies all transformations of the team.
- Runs tests defined over the transformations.
OK, so how do you propose to work from now on?
This is the good part.
Differentiate managed from self-service data
How do you build an analytics platform that is flexible enough to let people explore and answer their own questions, while at the same time making sure there are guardrails in place so that similar-sounding metrics that are calculated slightly differently don’t compete with each other, causing a loss of hard-earned trust in the data team? (Productizing Analytics: A Retrospective - by Emily Thompson (Mozilla, Fitbit))
To balance those competing needs, we will conceptually (and over time, logically) split each team data into two: managed data and self-service data.
From Data Management At Scale book:
Esto no quita para no tener una zona en la(s) plataforma(s) que usemos, con otros datasets menos cuidados, más crudos para exploración rápida.
🔗 to original context
-
Self-service data will work for you same as today, but no guarantees will be made for that data. Such data will end up living in a different dataset:
<your_team>_sandbox. -
If you want those guarantees, you will need to persist your transformations (along with tests and metadata) in redacted. Again, this will go on to a different dataset:
<your_team>_mart.
[Here I would saw a comparative table with the datasets the teams will end up having]
We will not set up automated restrictions for this. We trust you will do what’s best for your team and the rest of MTech.
Good practices
The practices we introduce here are independent of dbt, so you can apply them starting today, even for your sandbox dataset.
- Choose meaningful names (for tables, columns, CTEs, queries…).
- E.g.., The
df_prefix doesn’t say anything,masteris not a good name for a CTE…
- E.g.., The
- Ensure values are readable in your transformations. Avoid “magic numbers” with proper CASE statements. E.g., the status of an order shouldn’t be a number, but a descriptor: “purchased” instead of “6”. You can make this on top of a view of your data.
- Also avoid “magic dates”. E.g., if you are filtering by a specific date in your query, add a comment on why.
- Document non-evident tables, columns, values… as you go. Ideally on dbt. But at the very least, as SQL comments.
- Track your data model changes. E.g., if there is a change in the meaning of a column, or in a concept (“capacity” → “dimensioned_capacity” in slots), at the very least, document somewhere such change, the old and new definition, the dates. Avoid tribal knowledge. And better yet, abstract that change into a view so people can query consistently without having to know the details.
- Regularly test for and remove unwanted rows (particularly duplicates) and columns you don’t need to expose (automated testing is easier with dbt!).
- Standardize and reuse your transformations and metrics.
Standardize and reuse your transformations
This, and documentation are probably the most important steps you can take to avoid spiraling into chaos with your data.
- Build views of your data to reuse transformations you need (or tables if needed). Note that we are already creating base views for all tables of all teams as we migrate them to our new ELs. Base views will already give you an opportunity to clean your raw data and make it more query-friendly (by following best practices).
- Don’t create a new transformation if you can reuse an existing one.
- Deprecate and delete transformations you no longer use (if you have created a new version).
It is very easy from a technical perspective, just a little bit hard emotionally. Resist the urge to plow ahead:
It’s not difficult to imagine why this happens — people have different opinions, habits, and diligence about naming and when developing, it is often easier to build a new thing fit for the new purpose then to integrate your changes into the pre-existing ecosystem, test that yours works without breaking everyone else’s, etc. (On the Importance of Naming: Model Naming Conventions (Part 1) | dbt Developer Blog)
Or better yet, while you are on MVP phase, go ahead… but you should pay this data debt at some point, in the same way the engineering team pays its tech debt.
Dimensional modeling
Making a good dimensional modeling of your data is no small feat. We do not expect you to build your full data mart on your own. But it can give you ideas to transform your data in a more friendly way for your queries until Data takes care of it.
We talked about transforming your data from the OLTP model. But transform it into what? There are several ways to model data so that it is easier for analytical queries. The most popular method, proposed in 1996 and, amazingly, still prevalent today with modern data warehouses, is Kimball Dimensional Modeling. This data model, in essence, groups your data into two different kinds of tables:
- Fact tables: store your business events.
- Dimensions: are the attributes we could use to filter and group.
The resulting schema is called star schema: because when we visualize the table relationships, the fact table is in the middle, surrounded by the dimension tables, and the connections to these tables are like the rays of a star.
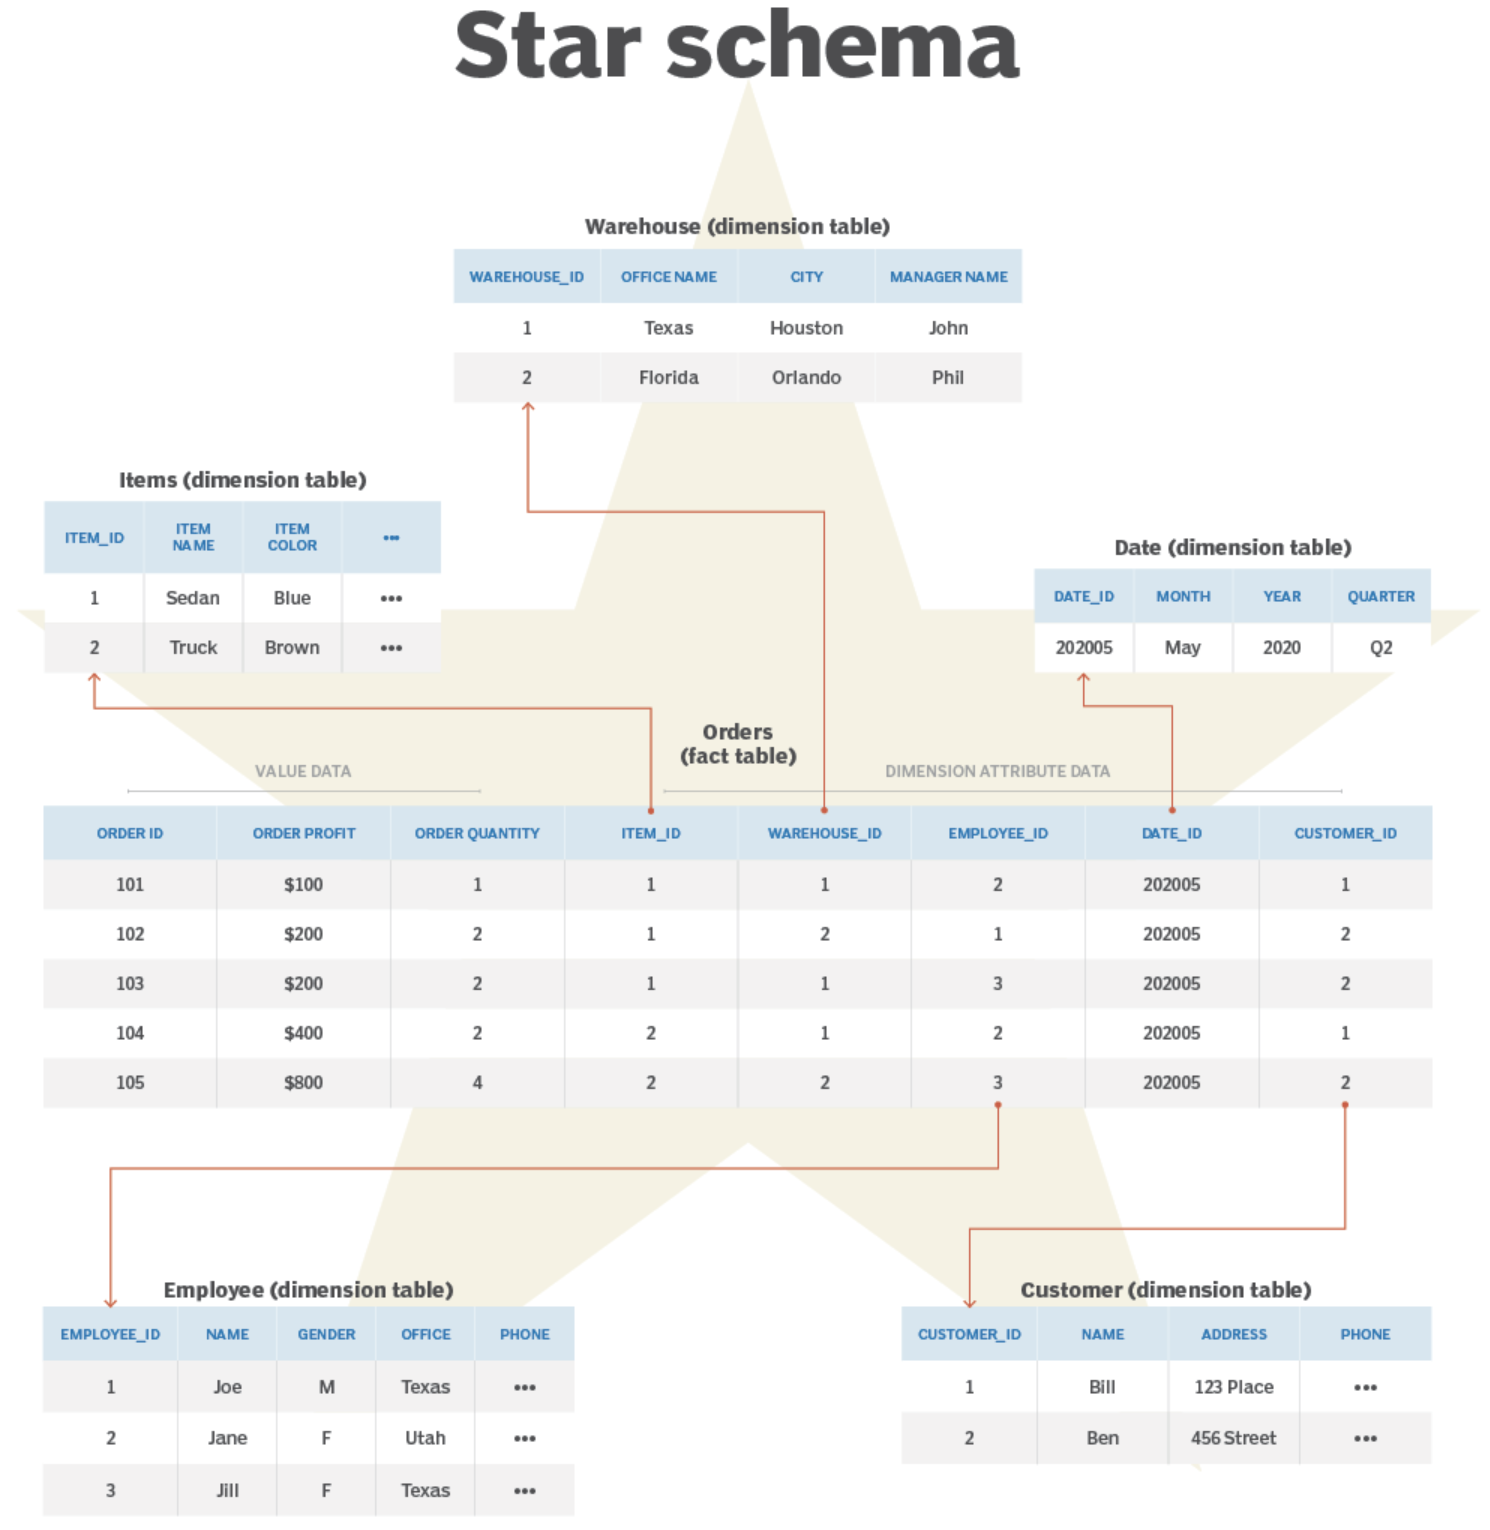
(from What is a star schema and how does it work?)
With this, we obtain two advantages. From “Advantages of Dimensional Modeling for Data Warehousing” in the Agile Data Warehouse Design book:
- Simplicity: less number of joins, and explicit facts at the center makes it easy to think about how the facts can be measured.
- Process-oriented: puts at the forefront what needs to be measured, how they are described in business terms and how they should be measured. They are not arbitrary collections of denormalizaed data but “the 7Ws”:
- Who is involved?
- What did they do? To what is it done?
- When did it happen?
- Where did it take place?
- How Many or much was recorded / how can it be measured?
- Why did it happen?
- How did it happen?
You can find a quick introduction to this in Data Modeling Layer & Concepts | The Analytics Setup Guidebook and “Stars and Snowflakes: Schemas for Analytics” in “Designing Data Intensive Applications”. book.
KPI / Metrics standardization
So there is a way to standardize transformations, but what about metrics? Metrics are different types of aggregations over your data, ranging from very simple to more complex.
- Simple aggregations
- Aggregation with scalar functions ( sum(Revenue) - sum(Cost) )
- Metrics that require joins (e.g., conversion rates)
- Metrics with window functions
- Metrics with multiple aggregation levels (e.g., market share ratios).
- Multi-fact metrics (e.g., sales and purchases)
(The metrics layer has growing up to do - Amit’s Newsletter)
Standardizing a metric has two parts:
In the world of BI, a metric is a succinct summarization of data to make it easily palatable to humans. Inherent to this are two concepts — the formula to be applied to summarize the data (metric formula definition) and the data to be summarized (metric data definition). (The 7 Traits of a Modern Metrics Stack | by Aakash Kambuj | Falkon).
The first part would be addressed by reusable transformations (primarily views) as we explained in the previous section. But what about the aggregation itself? There are more decisions to make in defining a metric.
Counting weekly orders in Europe, for example, requires you to define week, order, and Europe. Do weeks start on Sunday or Monday? In which time zone? Do orders include those made with gift cards? What about returns? And are European customers those with billing addresses or shipping addresses in Europe? Are Russian customers European? Are British customers European? (The missing piece of the modern data stack)
If you don’t do it, we end up with multiple slightly similar definitions ( Coalesce 2021)
What is the simplest way to standardize? Rollup views/tables: views or tables in which you have already made the aggregations, at the grain level you need, with the dimensions you’ll be interested to query.
Eventually, you may run into some problems by standardizing your metrics in this manner (an explosion in the number of rows and views, because you want to have many different grains/dimensions) but a better tech to handle this is on its way.
Main takeaways
- Your data is also your product. You are responsible of its quality and it starts to require some active care from you. We will definitely help (indirectly with tools, guides, etc. and directly), but 1. you know better, 2. you will move faster on your own.
- Data debt is more of a cultural problem than a technical problem: move fast, stay lean, but pay your data debt once you validated your ideas and want to put your data in production (in the same way you would do with your services). Good software engineering practices also apply here: meaningful naming, documentation, and tests are very important to make all our lives easier.
- Standardize using views, and resist the urge to create slightly different versions for not making the effort of understanding and integrating with existing work.