- Tags:: 📜Papers, Forecasting, Prophet
- Authors: Sean J Taylor, Benjamin Letham
- Link:: https://peerj.com/preprints/3190v2
- Zotero Link:: taylorForecastingScale2017
- Source date:: 2017-08-01
- Finished date:: 2021-07-24
The Prophet Forecasting Model
Prophet performs model fitting of data to the following: where:
- is the trend
- is the seasonality (if it is additive, there is also multiplicative).
- is the effect of holidays.
- and is additional error that can’t be modeled.
Claims to be better than:
- Arima:
- which creates large trend errors when there are change in trends near the cutoffs.
- don’t capture seasonality in an easy way (require modeling expertise).
- requires measurements to be regularly spaced.
- Exponential Smoothing Ets : fail to capture long-term seasonality (such as yearly).
- Tbats: “don’t adequately model yearly seasonality”.
Trend
- Allowed to change at certain steps (changepoints). Can be linear or logistic with saturation.
- The changepoints can be specified, but can be selected automatically. We have a knob to adjust which is the
changepoint_prior_scale, that allow us to specify less or more flexibility on the trend changes (and the usual risk of overfitting). - This is related to placing a Bayesian prior on whether there will be a changepoint at a particular place of not, with the form of a Laplace distribution.
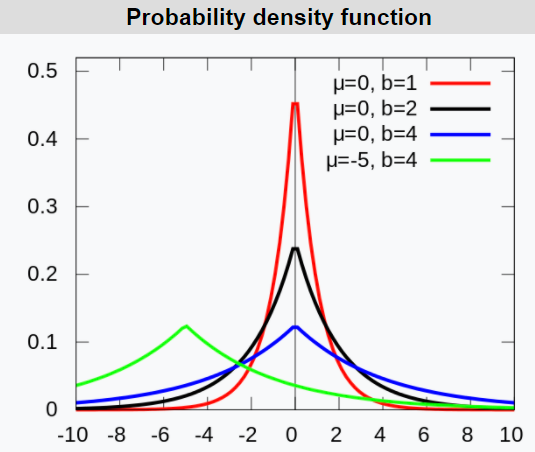
In the pic, that parameter is b but in the paper is , but that is not exactly changepoint_prior_scale, which I suppose has more to do with the peak value of the Laplace PDF. Note that this effectively a Lasso Regularization: most changepoints will be 0 (there will be no changepoint).
- For the forecasted trend, it is assumed that the future will change with the same frequency. This means that, if we give more flexibility to the model, we will have wider uncertainty intervals (and anyway, they might still be wrong, since the future may change its change rate).
Seasonality
- Fourier series are used, with N terms that allow to give less or more flexibilility. They indicate values of N=10 to model yearly seasonality, and N=3 to model weekly seasonality. These are not manually adjusted, we need to do so.
They are smoothed with a Normal(0, )
Holidays
Other stuff
There is an interesting discussion about blending human expertise (Judgmental Forecasts) and statistical forecasts, that they say they incentivize with Prophet: analyist-in-the-loop. (in consonance with similar discussions in Noise and Forecasting).
Nonetheless, the authors include a section on “Automating Evaluation of Forecasts”, when the number of forecasts is so high that we cannot review everything manually:
- By comparing with simpler baseline forecasts.
- By simulating predictions in the past so that we are aware of, for example, problematic dates or changepoints (e.g., from one month to the next, the error increases sharply)
Their CV makes forecasts at further-in-time cutoff points and then aggregate the metrics. It makes sense to aggregate the metrics by horizon because:
forecasting methods can perform better or worse with more data. A longer history can lead to worse forecasts when the model is misspecified and we are overfitting the past, for example using the sample mean to forecast a time series with a trend.
- Super cool Twitter thread by Sean on simple explanations of Prophet with gifs: https://twitter.com/seanjtaylor/status/1123278546539991040?s=20