. R/Entrepreneur
- Category:: 🗞️Articles
- Document tags:: Business Metrics
- URL:: https://www.reddit.com/r/Entrepreneur/comments/m3nk58/saas_company_kpis_an_ultimate_guide/
- Finished date:: 2023-05-16
Highlights
MRR stands for Monthly Recurring Revenue. That means the number of subscriptions that you bill each month (View Highlight)
If you multiply MRR x 12, you get ARR or annualized run rate (View Highlight)
So we take the customers at the beginning of the period as the denominator.
How to calculate Churn Alright, so let’s estimate the churn rate. Out of 100 users, we lost 10. That means that our customer churn rate was 10%. That means we have ten divided by 100. Remember, we are not counting the 100 users that we added in February. Those are new customers who weren’t here at the beginning of the period. (View Highlight)
If you divide one by a churn rate, in this case, one divided by 10% (or 1 divided by 0.1), you’ll get the average lifetime for a customer (View Highlight)
Can be inferred from the churn rate as the mean of the geometric distribution of the churn rate (1/churn rate) https://medium.com/@prashmaj/how-to-estimate-customer-lifetime-using-churn-rates-325f456a2f05 But we can do cooler things with ML.
Customer Lifetime Value (LTV) (View Highlight)
ARPU: average revenue per user. (View Highlight)
Some people also call that number ARPA, average revenue per account. This is mostly to distinguish that the ARPU/ARPA metric tracks your accounts, not your users. A company using Slack may have 50 or 1,000 employees. The SaaS metrics team mostly cares about the average revenue per company, (View Highlight)
Great, so LTV = ARPU/Customer Churn Rate (View Highlight)
As a general rule of thumb, it’s considered ideal that the cost of bringing a customer is one-third of the lifetime value. (View Highlight)
churn from the revenue side (View Highlight)
In that case, since we lost 2,900 (the revenue we had at the beginning of the period), and we get 10%. That is called our Gross Churn, and oftentimes, the number is quite similar to the Customer Churn number. So why do we measure it separately? Well, because you can lose revenue without losing a customer (View Highlight)
The amount of Lost customers is 10. From a batch of 100 customers, that’s s 10% customer churn. However, the amount of Lost MRR is $205, because there’s a mix of people from different plans. (View Highlight)
Now, when you are dealing with multiple plans, you might also have people switching between plans. (View Highlight)
While we have contraction revenue, we might also have expansion revenue from customers moving from the Starter plan to the Premium plan or adding new seats to their accounts (remember, we measure accounts, not individual seats). (View Highlight)
We might also have reactivation revenue; those are customers that canceled and that came back to reactivate their subscription. (View Highlight)
Technically that’s not considered New MRR because they were our customers already, so it’s classified separately as reactivation MRR. (View Highlight)
The sum of all of those variables: reactivation, expansion, contraction, and lost customers give us a number called Net MRR Churn, or Net Revenue Churn, and at least for us at Slidebean, it’s the most important number of all. (View Highlight)
That translates into $255 in extra MRR from the same group of users that we had at the beginning of the period. Once again, these are not new customers; these are existing customers. (View Highlight)
Also, let’s say we saw 7 users come back from the dead. They reactivated their accounts, some on the Starter plan, some on Premium plan. They added $169 in subscriptions. (View Highlight)
Well, it’s precisely that. It’s SaaS Nirvana! Really. Negative churn is the number that gets SaaS companies funded. (View Highlight)
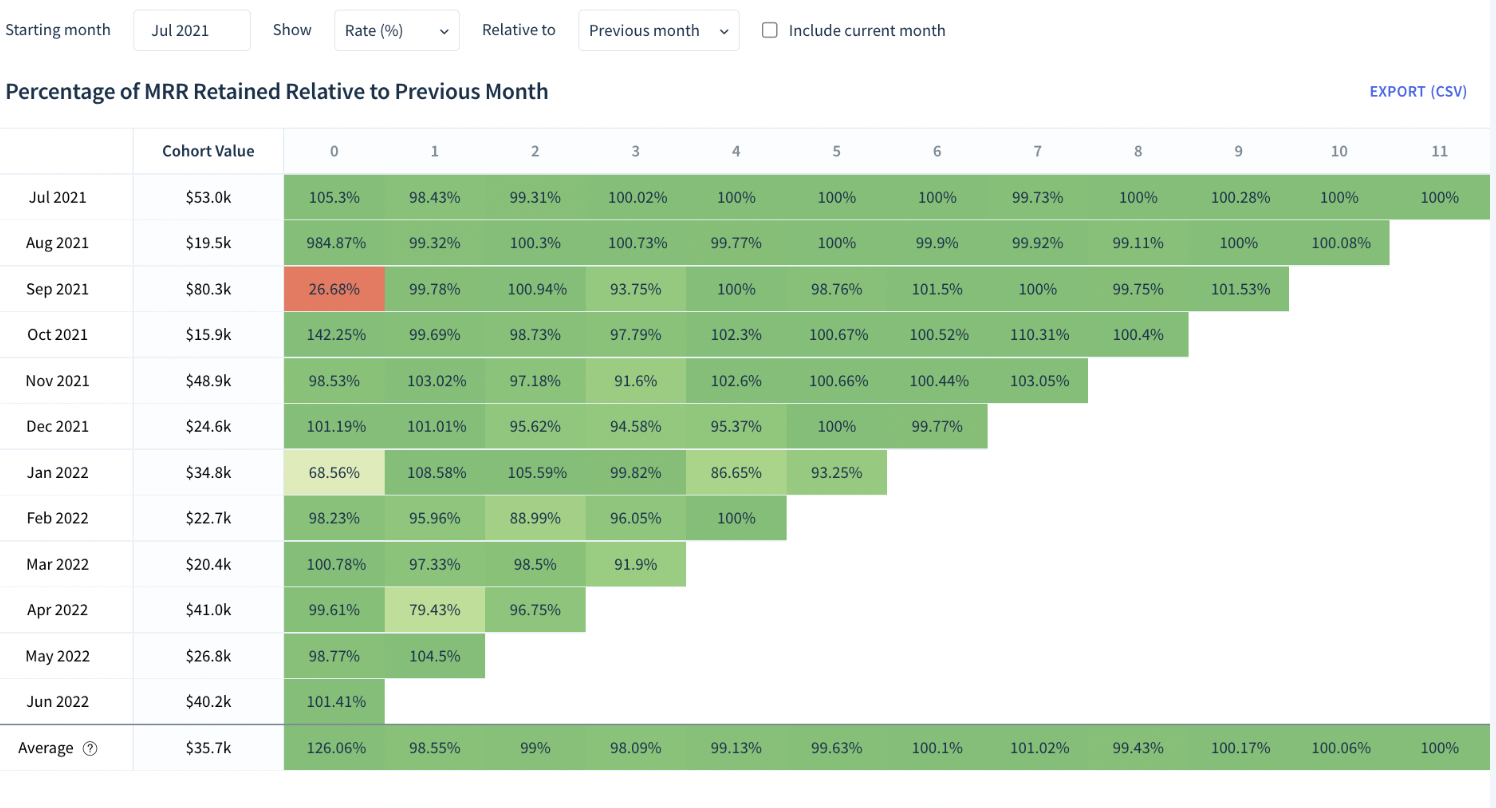
sometimes you want to look at a specific cohort of users: the users that converted on a given month and measure their behavior against users that came before. This is useful, for example, if you opened a new marketing channel on a given month or if you ran a promo. Discounts tend to bring low-quality customers. You can also use cohort tables to measure your effectiveness when increasing onboarding or retention. And this is how they look: If you look horizontally, you are looking at the cohort of users from a given month and how retention has been affected. If you look vertically, you are looking at the evolution: how many customers are you managing to retain by month 6, or by month 9, and how is that evolving over time. (View Highlight)
You can run cohort tables based on your customer churn, your gross churn, or ideally, based on your net MRR churn. In here, you’ll see Negative churn reflected as a retention rate higher than 100%. (View Highlight)