
Metadata
- Author: Tribe Capital
- Full Title:: A Quantitative Approach to Product Market Fit
- Category:: 🗞️Articles
- Document Tags:: Data Analysis, Metrics,
- URL:: https://tribecap.co/a-quantitative-approach-to-product-market-fit/
- Read date:: 2025-02-02
Highlights
we view product-market fit through three standardized analyses: • Growth Accounting • Customer Cohorts • Distribution of Product-Market Fit (View Highlight)
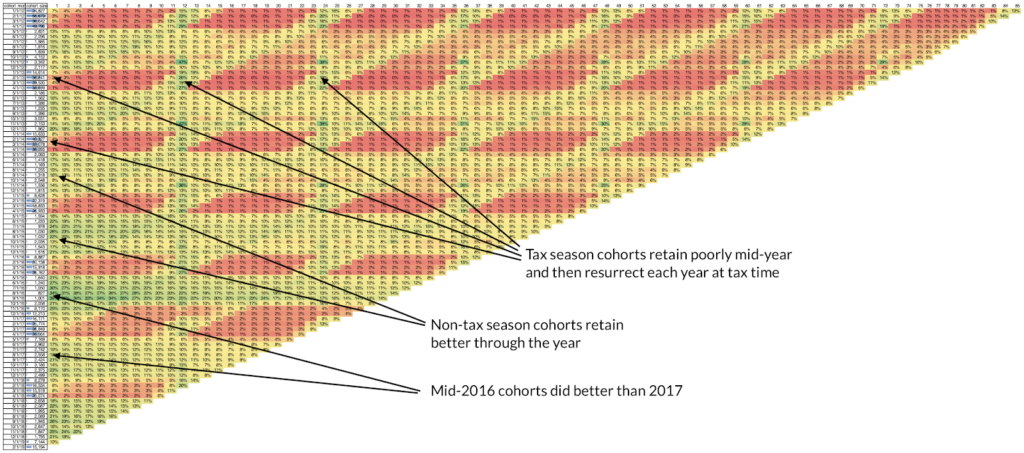
• Lifetime value (LTV): the cumulative activity of a customer cohort at a fixed time period (e.g. 12 months) after the customer first uses the product. • Revenue retention: the percentage of a cohort’s initial activity that is retained at a fixed time period afterwards. • Customer (logo) retention: the percentage of a cohort’s initial customers that is retained (i.e. still using/paying for the product) at a fixed time period afterwards. (View Highlight)
Reading each graph from left to right, we can see clearly which cohorts became outliers in either direction. Reading each graph from top to bottom, the heatmaps help you see the decrease in revenue retention and revenue LTV per customer in newer cohorts (as well as a slowdown in overall cohort size growth). (View Highlight)
 (
(the cumulative distribution function of monthly revenue. This does a few things for us. First, it gives us a sense of what “typical” looks like. Many companies quote average contract value (ACV) but this quantity tends to be dragged around by outliers and often doesn’t illustrate the “typical” customer. Of course, ACV is useful because that’s what actually hits the bank account, but we generally want to know both the ACV as well as the overall distribution of contract values and the CDF enables us to see the median and other percentiles/quantiles. (View Highlight)
In general, as the two lines separate it indicates a divergence in the distribution of customers and the distribution of revenue. (View Highlight)
We almost always find the CDF more useful than a histogram or other probability distribution function. This is because the CDF is less sensitive to bucketing whereas histograms tend to have bucketing issues. (View Highlight)
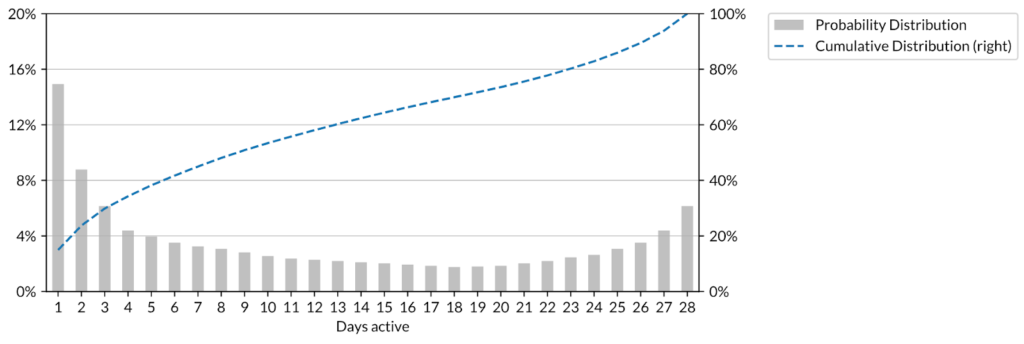
slightly modified approach can be used to understand engagement. In this context the analysis is often phrased in terms of the concept of “L28”. Given N monthly active users, we plot the fraction that were active only 1 day in the month, then 2 days, and so on. For instance, a given product might have a median number of active days per month at 3 with the top quintile of users active more than 5 days. (View Highlight)
 (
(