## Metadata
- Author: [[Ergest xheblati|Ergest Xheblati]]
- Full Title:: Debugging Your Business With Data
- Category:: #🗞️Articles
- Document Tags:: [[Data analysis|Data analysis]], [[Metric trees|Metric Trees]],
- URL:: https://sqlpatterns.com/p/debugging-your-business-with-data
- Finished date:: [[2024-04-21]]
## Highlights
> That’s why, as Cedric explains, the [[wbr|Wbr]] is done deliberately in the direction of causes → effects (input metrics → output metrics). ([View Highlight](https://read.readwise.io/read/01hw0dt7p73q7kwhxf9hgcxmqw))
> **Ankur**: So the first thing we did was try to contextualize it – **how much of an anomaly is this metric?** The most important question in root cause analysis is actually just: “does this even matter?” ([View Highlight](https://read.readwise.io/read/01hw0dx1fvh1z71n2jgm9ecb1s))
> the changes in a metric as resulting from **5 possible causes:** ([View Highlight](https://read.readwise.io/read/01hw0dya7rcy4j4qjfx5apm6w9))
> **Component Drift**, which is when the algebraic components of a metric have changed ([View Highlight](https://read.readwise.io/read/01hw0dyct1kydba8remarhrkn7))
> **Seasonality**, ([View Highlight](https://read.readwise.io/read/01hw0dyqf4r85xg993fwwkqkne))
> Segment Drift ([View Highlight](https://read.readwise.io/read/01hw0dz3dft2mkb2prqx29fhqe))
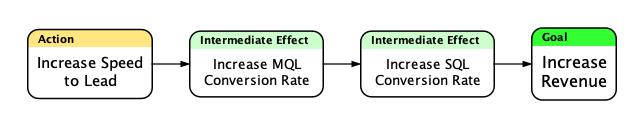
> **Influence Drift**, which is when a metric is moving because some probabilistic driver upstream has changed. Abhi’s favorite example is that speed-to-lead influences conversion rates and changes in speed-to-lead can therefore result in changes to conversation rates. ([View Highlight](https://read.readwise.io/read/01hw0fp4wqg17w37zhdfvah1mr))
> **Event Shocks**, which is when some kind of event has taken place within the company or outside the company that has disrupted key processes. For example, a new product launch or pricing change has changed the level of interest the market has in our products. ([View Highlight](https://read.readwise.io/read/01hw0fpwff8hbr1w80md8vwjm6))
> The point of RCA is to bound the search space – it's to use quantitative methods to “shine the flashlight” on where to deploy the last-mile qualitative investigation ([View Highlight](https://read.readwise.io/read/01hw0frvchqd1hem2n41mvd9q5))
> **Ankur**: Yeah, I want to underscore the “robust framework” piece here. When I’ve done RCA in the past, it has always been hypothesis-driven – start with a bunch of hypotheses based on things we’ve seen before – seasonality, cohort “bake time”, etc., and see whether those seem to align with the reality we’re looking at. ([View Highlight](https://read.readwise.io/read/01hw0ft3gzfm0waqbfyby5wnt9))