- Tags:: Course, Postgresql, Bbdds
- Author:: David Vazquez (Hoplasoftware)
- Link:: Corporate
- Source date:: 2022-02-14
- Finished date:: 2022-02-14
Intro
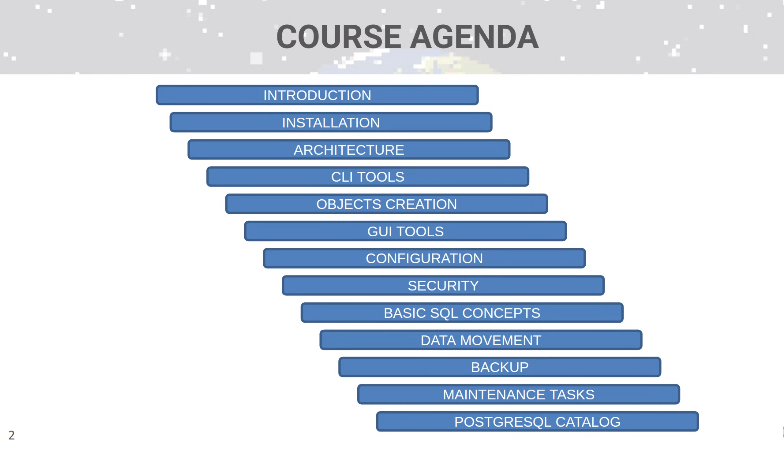
Architecture
Postgresql processes
- Review processes
Checkpointer
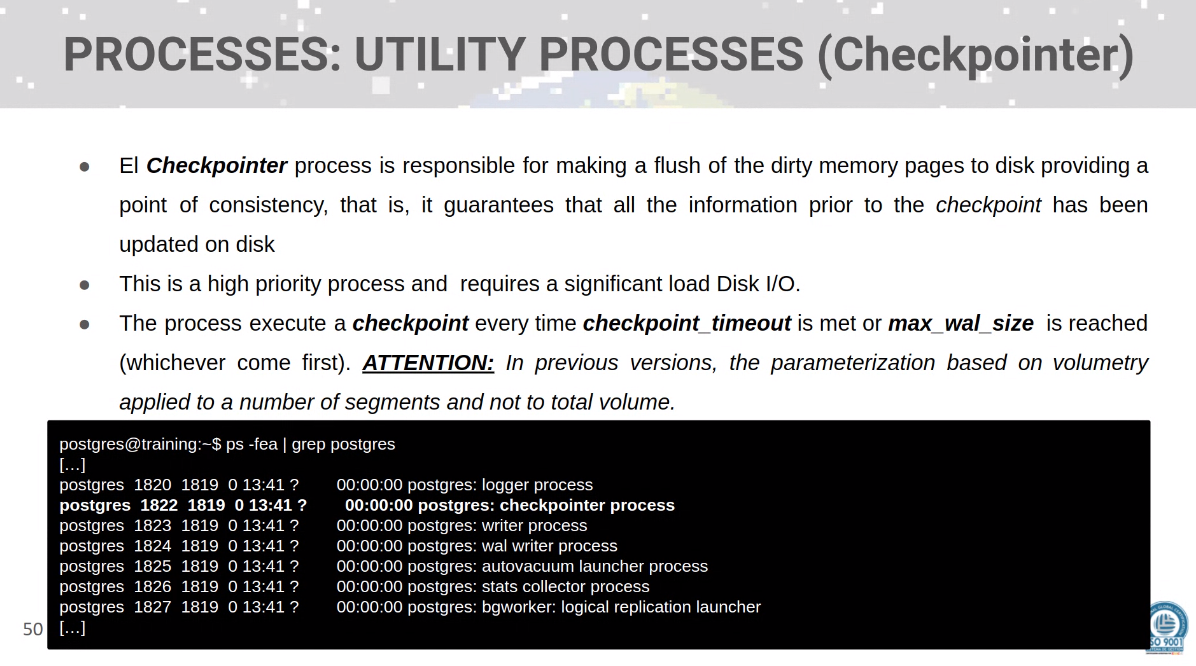
- Review, because there is a tradeoff on the frequency of checkpoints (recovery time vs DB load while operating). He suggests 15 min over the default 5 min, but he does not really offers a reason for that.
Autovacuum
He says that if there is a progressive degradation of a DB, his first thought would be an autovacuum not running. And one the main reasons for vacuum not running would be **idle in transaction** (although I’m not sure about this… shouldn’t this be killed at the end of the ? Nope, it just affects active queries)statement_timeout
He considers that using manual vacuum makes sense in a maintenance window (to avoid not running vacuum for a long time because you were not aware of this). Although this is a controversial topic.
Query planners
- Exhaustive search
- GEQO: support for larger queries (many joins) which cannot be solved with exhaustive search (because of time restrictions).
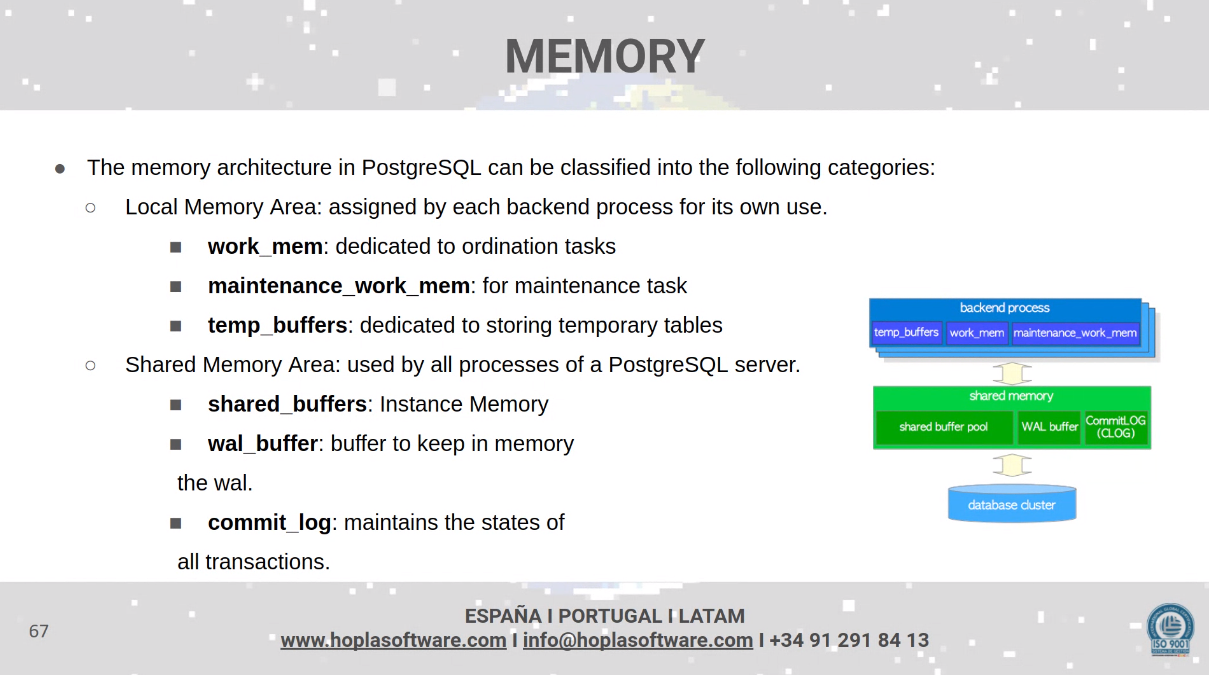
Memory
(Own note: remember there are services that help configure this, such as PGTune - calculate configuration for PostgreSQL based on the maximum performance for a given hardware configuration)
Disk
-
A lot of emphasis on tablespaces: a mechanism to control where database objects are stored. However, it is going to be handled by PostgreSQL.
-
He does not recommend to focus much of things like page structure. He says that in the past, people played with the fillfactor:
The fillfactor for a table is a percentage between 10 and 100. 100 (complete packing) is the default. When a smaller fillfactor is specified,
INSERToperations pack table pages only to the indicated percentage; the remaining space on each page is reserved for updating rows on that page. This givesUPDATEa chance to place the updated copy of a row on the same page as the original, which is more efficient than placing it on a different page. For a table whose entries are never updated, complete packing is the best choice, but in heavily updated tables smaller fillfactors are appropriate. This parameter cannot be set for TOAST tables.
Memory and disk access
Reading
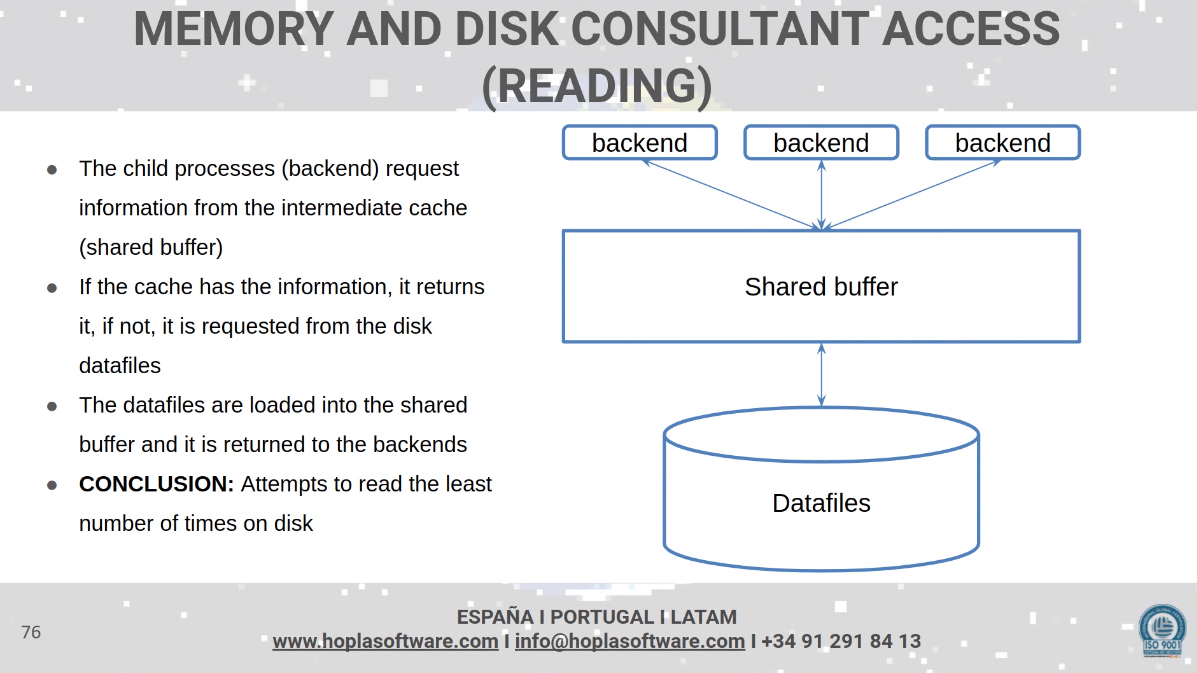
Important here is the hit rate on that shared buffer: Understanding Postgres Performance - Craig Kerstiens
The typical rule for most applications is that only a fraction of its data is regularly accessed. As with many other things data can tend to follow the 80/20 rule with 20% of your data accounting for 80% of the reads and often times its higher than this. Postgres itself actually tracks access patterns of your data and will on its own keep frequently accessed data in cache. Generally you want your database to have a cache hit rate of about 99%.
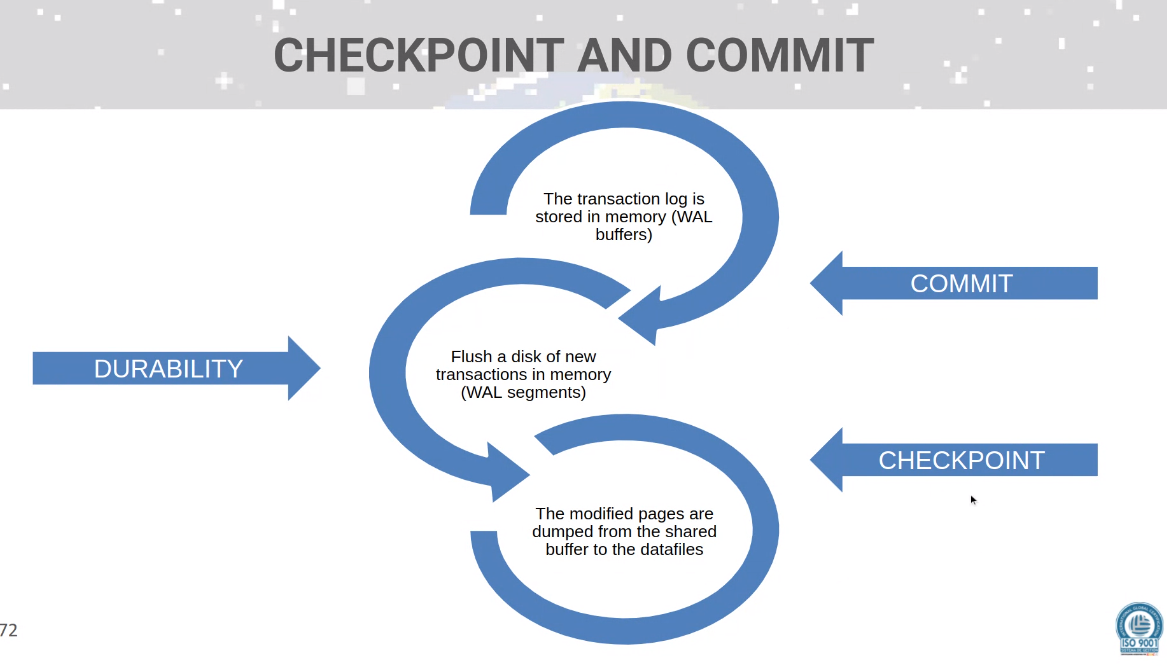
Writing
See the slide on checkpointing.
CLI Tools
PSQL Metacommands
\e [filename]: you can use it to edit the query buffer and relaunch it with the modifications you want. With filename you edit and run a file sql.\s [filename]: show the history or save it to file.
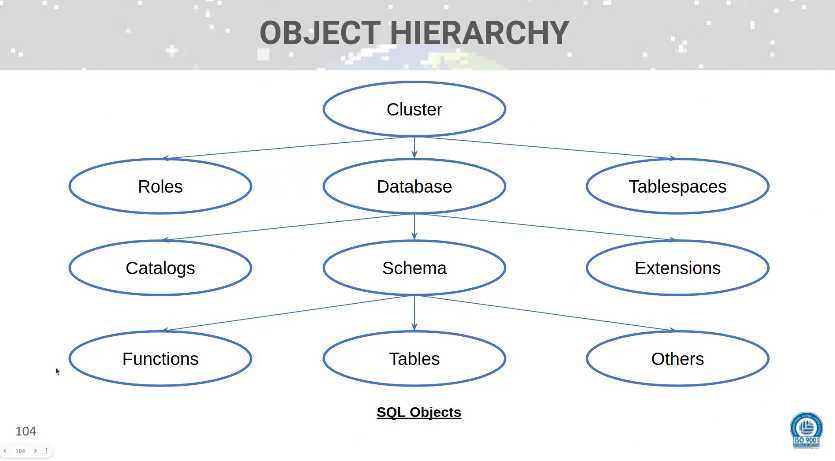
Object creation
- Changing the size of the shared buffer will require an instance restart.
Configuration
-
Changing params from
ALTER SYSTEMvs.postgresql.confdoes not mean the changes will be applied live without restart, that still depends on the type of change. Inpostgresql.confis indicated whether the change requires a restart or not. -
Remember that
max_connectionshave a trade-off. -
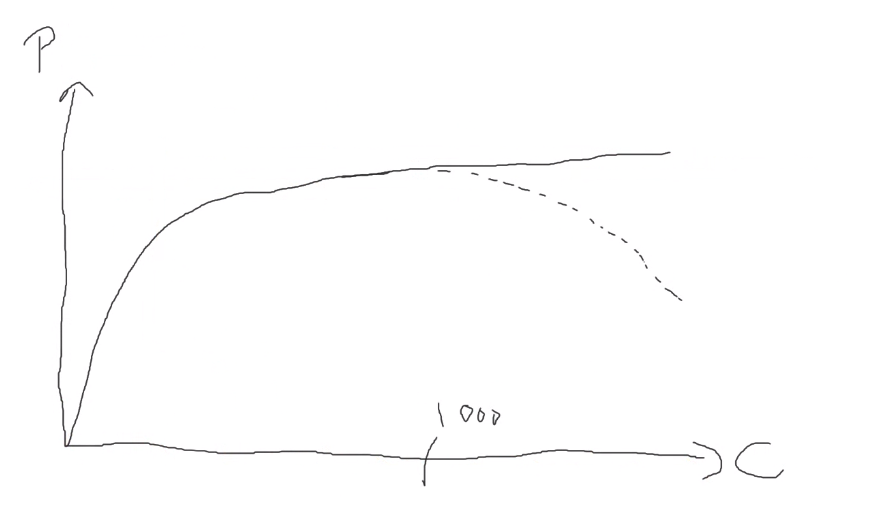
From postgresql - How to increase the max connections in postgres? - Stack Overflow
Just increasing
max_connectionsis bad idea. You need to increaseshared_buffersandkernel.shmmaxas well.
Before increasing your connection count you might need to scale up your deployment. But before that, you should consider whether you really need an increased connection limit.
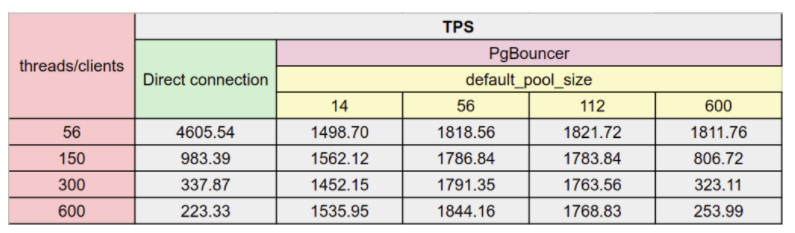
A well-written app typically doesn’t need a large number of connections. If you have an app that does need a large number of connections then consider using a tool such as pg_bouncer which can pool connections for you. As each connection consumes RAM, you should be looking to minimize their use.
It is suggested as a reference on what to do with connections Scaling PostgreSQL with PgBouncer: You May Need a Connection Pooler - Percona Database Performance Blog:
Total Memory Required
- OS
- Shared_buffer
- N (sessions/connections) * work_mem
- Maintenance_work_mem
- Autovaccum_work_mem
- temp (which he considers per session)
- Backend processess
Query planner settings
- For SSDs, you will usually want to reduce the
random_page_cost, which is set to 4.0, in comparison toseq_page_cost, set to 1.0: in an SSD, random access is not so slow (not 4 times slower) than sequential access. This is also as per the recommendations of PGTune for example).
Recommended changes to default
- vacuum_cost_limits = 1000 (up)
During the execution of VACUUM and ANALYZE commands, the system maintains an internal counter that keeps track of the estimated cost of the various I/O operations that are performed. When the accumulated cost reaches a limit (specified by
vacuum_cost_limit), the process performing the operation will sleep for a short period of time, as specified byvacuum_cost_delay. Then it will reset the counter and continue execution. - bgwrite_delay = 150 (down, more frequent)
- bgrwirte_lru_maxpages = 150 (up, more pages to flush)
- effective_io_concurrency = (increase depending on the number of driver). ⚠ Be careful when changing this, do it in small increments and see.
- To spread the load of the checkpointer, make it more frequent:
- checkpoint_timeout = 10 or 15 (up)
- max_wal_size = 2GB (up)
- min_wal_size = 200Mb (up)
- checkpoint_completion_target = 0.95 (up)
Time spent flushing dirty buffers during checkpoint, as fraction of checkpoint interval
- Autovacuum:
- Always by default except when you want to be more aggressive (reduction in
autovacuum_scale_factorto 0.10: fraction of table size before vacuum, andautovacuum_analyze_scale_factorto 0.08).
- Always by default except when you want to be more aggressive (reduction in
Own note: in addition to PGTune, note that there are excellent resources to help tune an instance, such as Tuning Your PostgreSQL Server - PostgreSQL wiki
Basic SQL concepts
Sync vs async replication
💡 “Synchronous Versus Asynchronous Replication” p. 153 in Designing Data-Intensive Applications book
Sync only when RPO = 0 and it is absolutely needed for the application.
- RPO: Recovery point objective. The maximum acceptable amount of data loss after an unplanned data-loss incident, expressed as an amount of time.
Synchronous replication has a moderate cost in terms of performance.
Indexes
- Once we have a defrag of 10-30% (by checking
pg_stat_all_indexes), run a reindex. - Defrag obviously occurs depending on how much the indexed tables change.
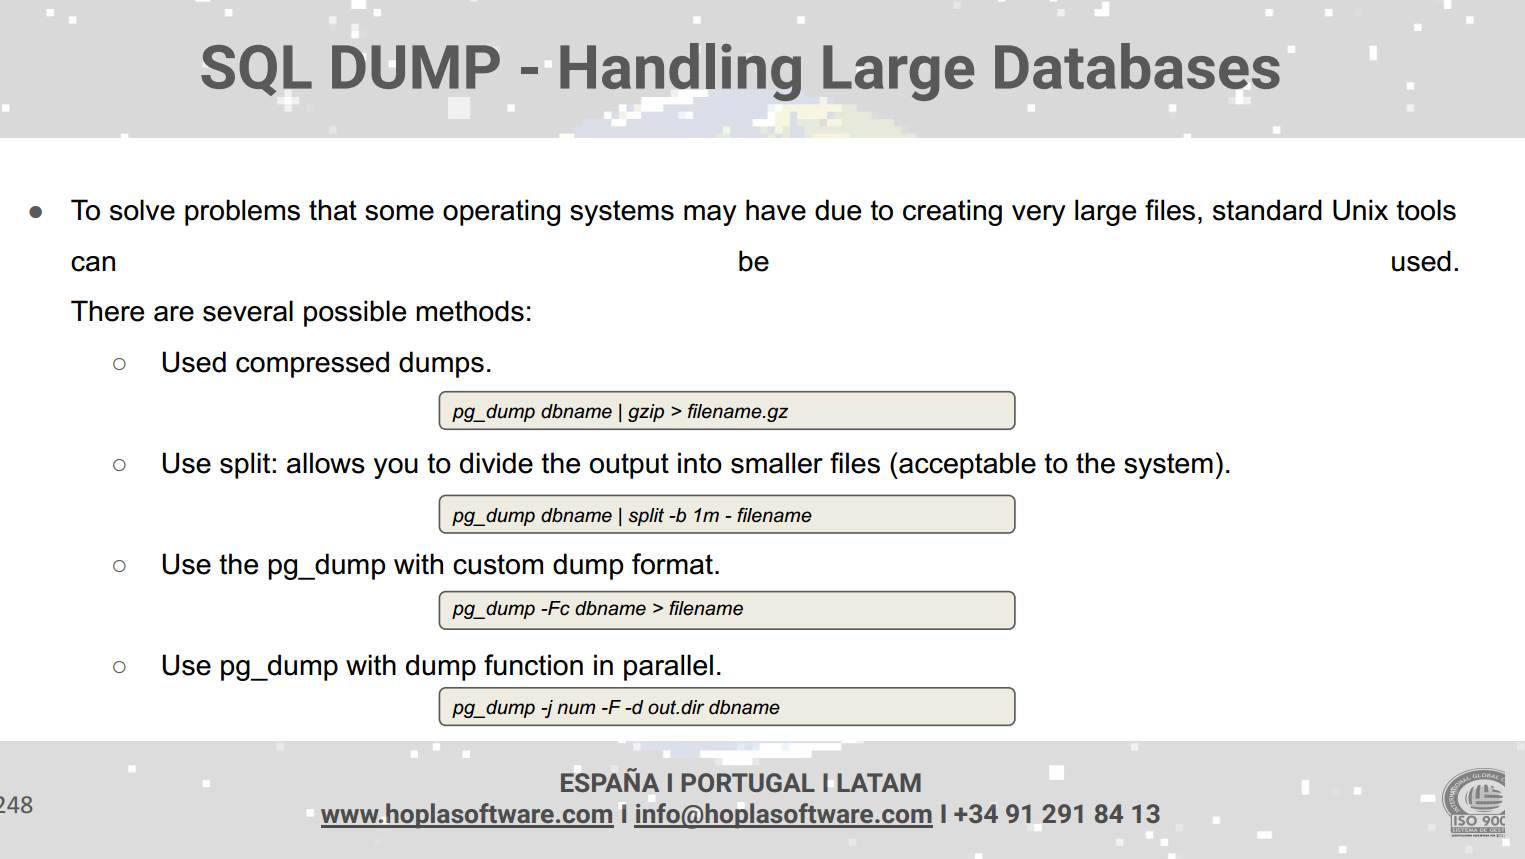
Data movement
- No alternatives for different data formats
- Review ELs memory consumption: COPY TO uses as much mem as there is available. But this could cause a problem in k8s pods?
Backups
Maintenance
- Nunca haremos un vacuum full de manera automatizada ni es habitual: el espacio dirty ya se irá reutilizando para qué lo vamos a querer recuperar si lo vamos a llenar. Haríamos vacuum full en un momento dado si hemos tenido un borrado muy grande, por ejemplo.
(Curiosity) For multi-version concurrency control (MVCC, see “implementing snapshot isolation” on p. 239 of Designing Data Intensive Applications), a transaction ID is used, which has a maximum size of 32 bits. In case of reaching that huge number (4 billion transactions) without a vacuum, we would suffer from transaction id wraparound. Very weird scenario.
- Review MVCC
A defragmented index surely makes an imbalanced index. Not the other way around necessarily. So, obviously, defragmentatrion is a good signal to reindex.
For our periodic cleanup needs:
- Delete old data
- Reindex (concurrent)
- Vacuum
- Analyze
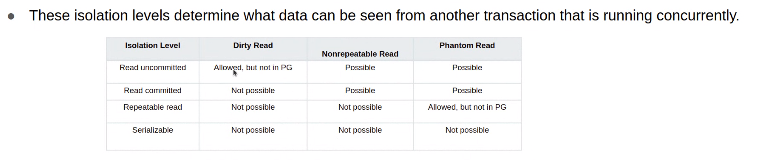
Transactions
Extensions
Wait events
With Postgres 9.6 and newer, we got the chance to become more sophisticated, through the introduction of wait events. Wait Events tell you the details on what a Postgres connection is currently waiting on, in particular if it’s not actually processing something in the CPU. One example of a wait event may be
IO / DataFileRead, which indicates that a process is currently waiting for data to be read from disk or the page cache (Postgres Connection Tracing, Wait Event Analysis & Vacuum Monitoring go into GA on pganalyze · pganalyze)
Which we can try to get info about with postgrespro/pg_wait_sampling: Sampling based statistics of wait events (github.com)
Though David says that, obviously, adding more and more extensions have a cost in terms of performance.